SAS is a software suite that can mine, alter, manage and retrieve data from a variety of sources and perform statistical analysis on it. It was developed by SAS Institute.
These are the following questions with the explanation:
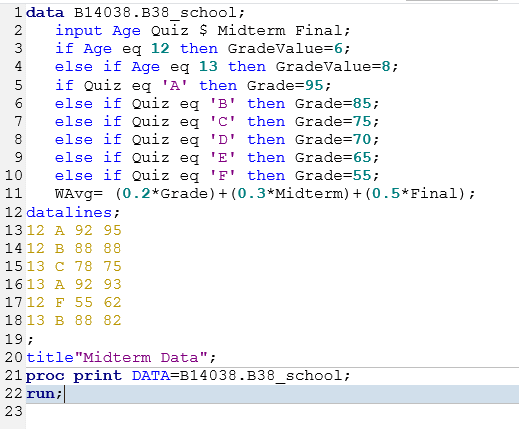
1. Run the program here to create a temporary SAS data set called School:
data school;
input Age Quiz : $1. Midterm Final;
/* Add you statements here */
datalines;
12 A 92 95
12 B 88 88
13 C 78 75
13 A 92 93
12 F 55 62
13 B 88 82
;
Using IF and ELSE IF statements, compute two new variables as follows: Grade
(numeric), with a value of 6 if Age is 12 and a value of 8 if Age is 13.
The quiz grades have numerical equivalents as follows: A = 95, B = 85, C = 75,
D = 70, and F = 65. Using this information, compute a course grade (Course) as a
weighted average of the Quiz (20%), Midterm (30%) and Final (50%).
Ans: Program for this question:
 |
| Fig 1 |
Explanation:
1. A data set named school is created. Then with the INPUT statement the variables are initialized.
2. If the variable is a character then a "$" sign has to be there after the variable.
3. Then to write the condition if and else if statement are used.
4. Here in the if statement "eq" is used which means "equal to" .
5. So 1st it will check the condition of if statement, if its true then it is executed. Otherwise it will execute the else statement.
6. To calculate the weighted average, we can directly put the formula which is given in the question.
7. Then the datalines are mentioned, so that the value for each variable can be given.
8. After writing the logic, to see the output proc print is used.
9. "Run" is used to run the whole program and see the output.
Output:
 |
| Fig 2 |
values of 5, 100, 150, and 200. Do this twice, once using OR operators and once
using the IN operator.
Note: Subject is a numeric variable.
Ans: Program for this question:
 |
| Fig 3 |
1. A data set hosp is created.
2. In question, it is asked to get output of only Subjects whose values are 5, 100, 150 and 200.
3. This is done by using "in" operator.
Output:
 |
| Fig 4 |
OR Operator
 |
| Fig 5 |
1. In OR operator, you have to mention each and every condition individually.
2. For the operator to work, we have to use "where" clause.
Output:
 |
| Fig 6 |
and TotalSales plus a new variable called Weight with values of 1.5 for the North
Region, 1.7 for the South Region, and 2.0 for the West and East Regions. Use a
SELECT statement to do this.
Ans: Program for this question:
 |
| Fig 7 |
1. The SET statement reads an observation from the most recently created data set.
2. Drop is used to delete the column of the described data set.
3. The select statement executes one of several statements or groups of statements based on the value of the expression that you specify.
4. Each when statement is executed line by line.Output:
 |
| Fig 8 |
4. Create and print a data set with variables N and LogN, where LogN is the natural log
of N (the function is LOG). Use a DO loop to create a table showing values of N and
LogN for values of N going from 1 to 20.
Ans: Program for this question:
 |
| Fig 9 |
1. In DO loop, 1st a range is described.
2. In the question, it is given that the range should be from 1 to 20.
3. "log" function is used to calculate the log value of the numbers.
Output:
 |
| Fig 10 |
5. Create and print a data set with variables N and LogN, where LogN is the natural log
of N (the function is LOG). Use a DO loop to create a table showing values of N and
LogN for values of the range of N go from 5 to 100 by 5.
Ans: Program for this question:
 |
| Fig 11 |
Explanation:
1. In DO loop, 1st a range is described.
2. In the question, it is given that the range should be a multiple of 5 till 100.
3. So simply by writing "BY" it will divide the range with 5 and will take all the multiples of 5.
4. "log" function is used to calculate the log value of the numbers.
Output:
 |
| Fig 12 |
10 subjects to each of the three methods. You are given the results as three lines of
reading speeds, each line representing the results from each of the three methods,
respectively. Here are the results:
250 255 256 300 244 268 301 322 256 333
267 275 256 320 250 340 345 290 280 300
350 350 340 290 377 401 380 310 299 399
Create a temporary SAS data set from these three lines of data. Each observation
should contain Method (A, B, or C), and Score. There should be 30 observations in
this data set. Use a DO loop to create the Method variable and remember to use a
single trailing @ in your INPUT statement. Provide a listing of this data set using
PROC PRINT.
Ans: Program for this question:
 |
| Fig 13 |
1. In this do loop is used.
2. Read is used to initialize the data from datalines. Where A belongs to the 1st line of dataline.
3. The inner do loop is used because the datalines contain from 1 to 10 values.
4. "@" is used to input the data as it is from datalines.
Output:
 |
| Fig 14 |
7. Using the following lines of data, create a temporary SAS data set called ThreeDates.
Each line of data contains three dates, the first two in the form mm/dd/yyyy
descenders and the last in the form ddmmmyyyy. Name the three date variables
Date1, Date2, and Date3. Format all three using the MMDDYY10. format. Include in
your data set the number of years from Date1 to Date2 (Year12) and the number of
years from Date2 to Date3 (Year23). Round these values to the nearest year. Here are
the lines of data (note that the columns do not line up):
01/03/1950 01/03/1960 03Jan1970
05/15/2000 05/15/2002 15May2003
10/10/1998 11/12/2000 25Dec2005
Ans. Program for this question:
 |
| Fig 15 |
1. In input statement, "@" is used to signify the column number of each datalines.
2. So that while reading from the datalines, compiler can understand the from which column number it can easily identify the variables.
3. Format is used for the smooth install of data from datalines.
4. YRDIF is used to calculate the difference between two years.
5. In that function 1st two variable signifies the data from which we have to calculate the difference and the 3rd variable is in which it will store the difference.
Output:
 |
| Fig 16 |
8. Count the number of missing values for WBC, RBC, and Chol in the Blood data set.
Use the MISSING function to detect missing values.
Ans: Program for this question:
 |
| Fig 17 |
Explanation:
1. Here we have to count the values of each missing value in the given columns in the questions.
2. So by using missing function we can detect the missing value in that column.
3. By using if statement, we have given a condition to find out the missing value. If its true then increment the value by 1.
4. Similarly it is done for other two variables.
Output:
 |
| Fig 18 |
9. Using the Sales data set, create a temporary SAS data set (Spirited) containing all the
observations from Sales where the string (not necessarily the word) SPIRIT in either
upper-, lower-, or mixed case is part of the Customer value (variable name
Customer).
Ans: Program for this question:
 |
| Fig 19 |
1. In this question, we are asked to find out the customer's name with "spirit" irrespective of its case.
2. So, by using find function we can find the asked data.
3. In bracket 1st we mention the variable from where we have to find then what we have to find.
Output:
 |
| Fig 20 |
data vitals;
input ID : #3.
Age
Pulse
SBP
DBP;
label SBP = "Systolic Blood Pressure"
DBP = "Diastolic Blood Pressure";
datalines;
001 23 68 120 80
002 55 72 188 96
003 78 82 200 100
004 18 58 110 70
005 43 52 120 82
006 37 74 150 98
007 . 82 140 100
;
Using this data set, create a new data set (NewVitals) with the following new
variables:
For subjects less than 50 years of age:
If Pulse is less than 70, set PulseGroup equal to Low;
otherwise, set PulseGroup equal to High.
If SBP is less than 130, set SBPGroup equal to Low;
otherwise, set SBPGroup equal to High.
For subjects greater than or equal to 50 years of age:
If Pulse is less than 74, set PulseGroup equal to Low;
otherwise, set PulseGroup equal to High.
If SBP is less than 140, set SBPGroup equal to Low;
otherwise, set SBPGroup equal to High.
Ans: Program for this question:
 |
| Fig 21 |
1. In this program,we are using nested if else statement
2. 1st the if statement is executed and if its true then inner if else statement are executed.
3. If the outer if statement is not executed then it will move to else if statement.
4. Then it will execute the inner if else statement.
Output:
 |
| Fig 22 |